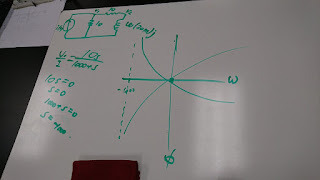
The frequency response of a circuit is the variation in its behavior with change in signal frequency, and is also be considered as the variation of the gain and phase with frequency.
The transfer function H(ω) of a circuit is the frequency-dependent ratio of a phasor output Y(ω) (an element voltage or current) to a phasor input X(ω) (source voltage or current).
An easier way to view transfer function is just simply replace all the jω to s.
The transfer function H(ω) can be expressed in terms of its numerator polynomial N(ω) and denominator polynomial D(ω) as

The roots of N(ω) = 0 are called the zeros of H(ω).
The roots of D(ω) = 0 are called the poles of H(ω).
By knowing the value that makes N(ω) = 0 and D(ω) = 0, we can plot the graph of transfer function.
We did some simple examples of transfer function by using current divider.


Next, we introduced the decibel scale.
Because it is now easy to quickly plot the magnitude and phase of the transfer function, we introduced a more systematic way of obtaining the frequency response--Bode plots.
Two things are important to note from the decibel (dB) equations:
1. That 10 log is used for power, while 20 log is used for voltage or current, because of the square relationship between them (P = V^2/R = I 2 R).
2. That the dB value is a logarithmic measurement of the ratio of one variable to another of the same type. Therefore, it applies in expressing the transfer function H when it is a gain which are dimensionless quantities, but not when it is an impedance
(From Day 25 Frequency Dependencec.pdf)
Then, we did lab.
Signals with Multiple Frequency Components
Pre-lab

The magnitude response (the ratio of the amplitude of the output sinusoid to the input sinusoid) of the circuit at frequencies of 500Hz, 1000Hz, and 10kHz.
As the frequency increases, the voltage gain decreases.
Result:
Use the waveform generator to apply a custom waveform to the circuit.

The yellow line is the output voltage across the resistor, and the blue line is the input voltage of the circuit.
The overall shape is a sine wave forming from a lot of small waves.
A low frequency signal has a bigger magnitude of gain and a high frequency signal has a smaller magnitude of gain.
Use the waveform generator to apply a sinusoidal sweep to the circuit.

The yellow line is the output voltage across the resistor, and the blue line is the input voltage of the circuit.
This graph shows the gain of different frequencies signal from 100Hz to 10kHz.
When the frequency is low, the gain is relatively small, and when the frequency is high, the gain is relatively big.
Summary
The class before the 3rd exam, we learned frequency dependence, transfer functions, and decibel scale. By plotting the the transfer function graph, we can see that how to determine the gain of the circuit. From the lab, we know the relationship between the frequency and the gain.
No comments:
Post a Comment