Bode plots are semilog plots of the magnitude (in decibels) and phase (in degrees) of a transfer function versus frequency.
(From Day 26 BODE PLOTS.pdf)
H(ω) has seven different factors that can appear in various combinations in a transfer function.

We did a example in the class.

By following the summary of Bode plots for the seven factors, we can easily plot the transfer function.
Here is the summary of Bode plots for the seven factors:

Here is another example of how to plot the graph.


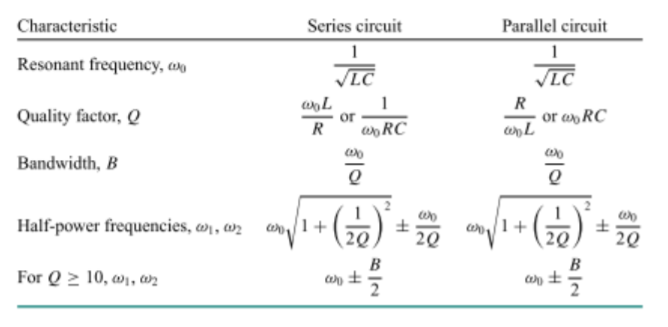
Then, we learned series resonance and parallel resonance.
Resonance is a condition in an RLC circuit in which the capacitive and inductive reactances are equal in magnitude, thereby resulting in a purely resistive impedance.
(From Day 26 BODE PLOTS.pdf)
We introduced a new thing called the quality factor.
The quality factor of a resonant circuit is the ratio of its resonant frequency
to its bandwidth.
The table below shows a summary of the characteristics of the series and parallel resonant circuits:
Summary
We basically practiced how to plot bode plots the entire day, and learned how to determine the transfer function by looking at the bode plot. After a lot of bode plots, we learned resonance which occurs in any circuit that has at least one inductor and one capacitor.
No comments:
Post a Comment